

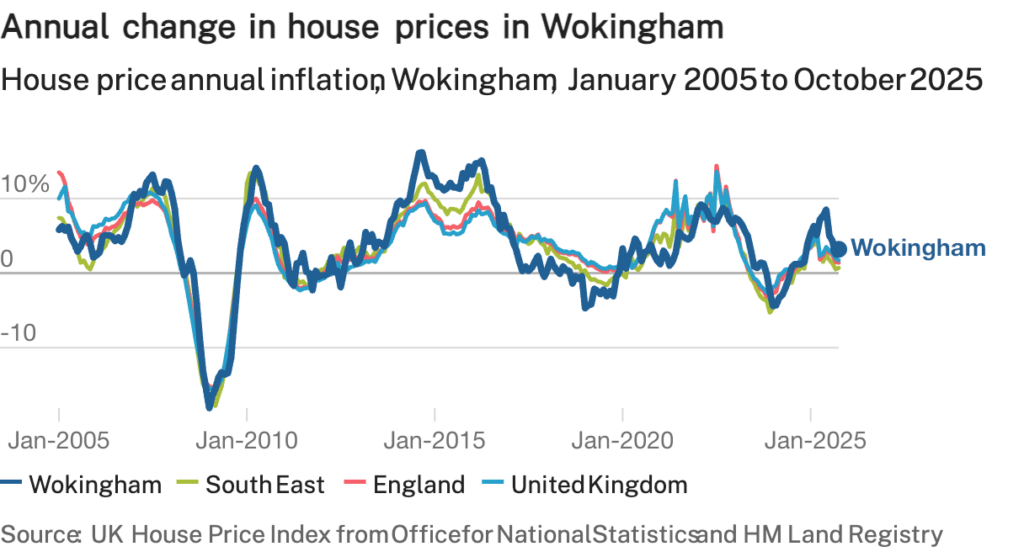
The latest ONS local housing data shows that Wokingham remains one of the most expensive and resilient markets in the South East.
-
Average house price (Oct 2025): £510,000 (provisional)
-
Up from £494,000 in October 2024 – a 3.2% annual rise. Office for National Statistics
-
This compares with an average £384,000 for the South East region and £270,000 across the UK in the same month. Office for National Statistics+1
Wokingham’s market is being underpinned by good schools, strong commuter links to Reading and London, and a relatively high-income local workforce, all of which have supported values even through periods of national uncertainty. Residential Analysts
📈 Wokingham: 10-Year House Price Trend (2015–2025)
Because the ONS local visualisation starts its chart in 2005, we can trace how Wokingham has moved over the past decade using council and UK House Price Index (UK HPI) data:
Key anchor points for Wokingham
-
2015 – pre-Brexit baseline
-
Wokingham Borough Council reported an average house price of £359,988 in November 2015, up £35,600 on November 2014. Wokingham Borough Council
-
-
2018 – late-cycle high before Covid
-
A local housing report for Wokingham cited an average house price of £416,000 in 2018 (all property types). Residential Analysts
-
-
2020–2021 – Covid period
-
UK HPI data shows the average price in October 2020 at around £425,476 (all properties). landregistry.data.gov.uk
-
Wokingham Borough’s housing facts and figures report then records an average of £426,274 in August 2021. Wokingham Borough Council
-
-
2025 – latest official figure
-
ONS/UK HPI puts the average price at £510,000 in October 2025 (provisional). Office for National Statistics+1
-
What that means in percentage terms
From these benchmarks we can see:
-
2015 → 2025:
-
From ~£360,000 to £510,000 – an increase of roughly £150,000 over 10 years.
-
That’s around 40–45% nominal growth over the decade (before inflation).
-
-
2018 → 2025:
-
From about £416,000 to £510,000 – an increase of c. £94,000.
-
Roughly 20–25% growth since 2018.
-
-
2020 → 2025:
-
From ~£425,000 (Oct 2020) to £510,000 (Oct 2025). landregistry.data.gov.uk+1
-
Around 20% growth in five years, despite the Covid shock, rising interest rates and cost-of-living pressures.
-
The broad story is that Wokingham has added roughly two-fifths to typical values in ten years, with a noticeable step-up around the Covid period (2020–2021) and then more moderate, but still positive, growth into 2024–2025.
💷 Rents and Affordability in Wokingham
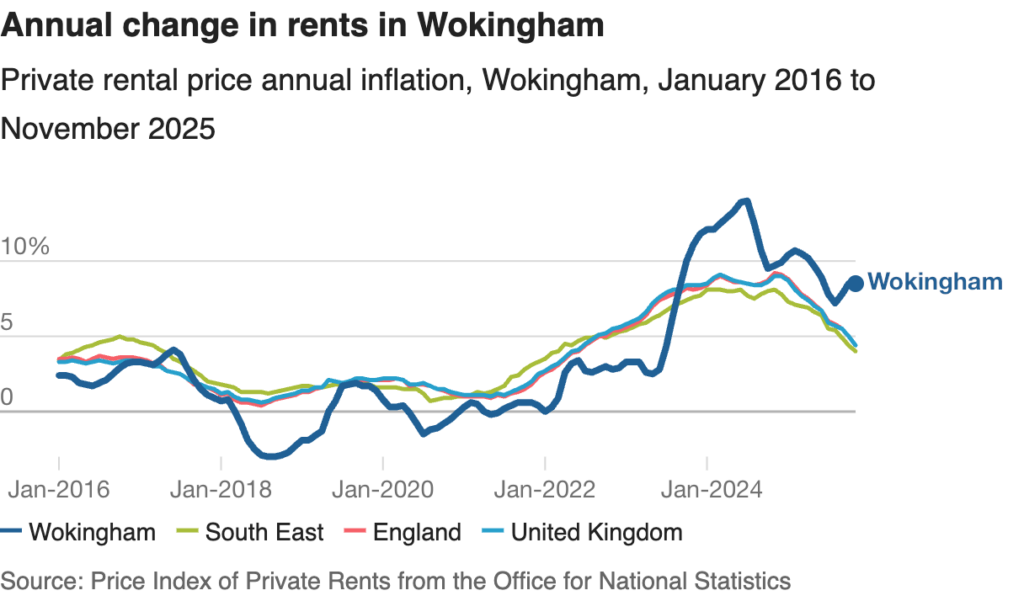
The ONS local profile for Wokingham also highlights strong private rent growth:
-
Average private rent (Nov 2025): £1,499 per month, up 8.5% in a year. Office for National Statistics
Rents rising faster than house prices over the last year suggest:
-
Ongoing pressure in the local lettings market (strong demand, limited supply).
-
A push factor into ownership for households who can stretch to a mortgage, supporting underlying buying demand even at high price levels.
🔮 2026 Outlook for Wokingham
There are no official ONS forecasts at local-authority level, but a range of national forecasters point to modest UK-wide house price growth in 2026:
-
Nationwide: expects UK house prices to grow 2–4% in 2026, helped by easing affordability pressures and lower mortgage rates. Nationwide+1
-
Rightmove: predicts around 2% UK price growth in 2026, with some regional variation. Rightmove
-
Capital Economics: forecasts a stronger 5% rise in UK house prices in 2026, supported by bigger-than-expected falls in mortgage rates. Capital Economics+1
-
An overview of forecasts collated by industry commentators suggests most reputable forecasts cluster between 2–4% growth for 2026, with a few more bullish at 5%. Howgates+1
Given Wokingham’s track record of outperforming national averages and its constrained housing supply, a reasonable working assumption is:
Wokingham’s average prices in 2026 are likely to grow in line with, or slightly above, the national range – say roughly 3–5% – assuming interest rates continue to ease and the local economy remains stable.
Of course, this is not a guaranteed prediction – it depends on:
-
How quickly mortgage rates fall
-
Wage growth and employment in the Thames Valley
-
Delivery of new housing in Wokingham and nearby growth areas
-
Any policy changes affecting tax, planning or lending
🧮 Historic Comparison: Wokingham vs Bracknell vs Reading (2015–2025)
To put Wokingham in context, it helps to compare it with Bracknell Forest and Reading, using the same ONS/UK HPI and local-authority sources.
1. Bracknell Forest – growth from mid-£300ks to around £400k
Current level
-
Average house price (Oct 2025): £399,000, up 1.5% on October 2024. Office for National Statistics+1
-
Bracknell Forest’s own monitoring report notes a similar £404,000 average in August 2025, 2.6% higher than a year earlier. Bracknell Forest Council
Historic points
-
UK HPI data shows monthly averages in 2015 typically around £290,000–£325,000, with October 2015 at £318,448 and December 2015 at £325,669. landregistry.data.gov.uk
10-year change (rough)
-
Mid-2015: c. £315k
-
2025: around £399k–£404k
-
That’s roughly 25–30% nominal growth over the decade – solid, but not as strong as Wokingham’s ~40–45%.
2. Reading – strong earlier gains, more muted recent years
Current level
-
ONS reports £349,000 average in October 2025, slightly down (-1.4%) from October 2024. Office for National Statistics+1
-
A local market summary using November 2025 data also quotes £349,000 as the average house price in Reading, confirming this figure. HomeNow UK
Historic points
-
A 2015–2016 price report for Reading shows average selling prices around:
-
Detached: ~£441,000
-
Semi-detached: ~£317,000
-
Terraced: ~£252,000 home.co.uk
-
-
A 2025 city guide for Reading’s tech sector notes that average house prices were already “approximately £350,000” by early 2025, reflecting steady growth over the years and keeping Reading above the national average. hexwired.com
Taken together, this suggests Reading:
-
Saw strong price growth in the mid-2010s
-
Reached the mid-£300k range by early 2020s, and
-
Has since experienced some softening or plateauing between 2024–2025, consistent with ONS data showing a small annual fall.
3. Side-by-Side Snapshot: 2015 vs 2025
Rounded figures based on the sources above (2015 numbers are approximate where only monthly or type-specific data are available):
| Area | Approx. Average Price c.2015* | Average Price 2025 (ONS local) | Rough 10-yr Change |
|---|---|---|---|
| Wokingham | ~£360k (Nov 2015) Wokingham Borough Council | £510k (Oct 2025) Office for National Statistics | +40–45% |
| Bracknell Forest | ~£315k (Oct–Dec 2015 around £318–326k) landregistry.data.gov.uk | £399k (Oct 2025) Office for National Statistics+1 | +25–30% |
| Reading | Low-to-mid £300ks overall inferred from 2015–16 selling prices by type home.co.uk | £349k (Oct 2025) Office for National Statistics+2Office for National Statistics+2 | Moderate rise, but recent dip |
* 2015 values for Bracknell and Reading are based on monthly/segment data, so they are best understood as reasonable approximations rather than single official annual averages.
🧠 What This Means for Buyers, Sellers and Investors
Wokingham
-
Has seen the strongest long-run price growth of the three, reflecting high demand and constrained supply.
-
Even if 2026 growth moderates to low single digits in line with national forecasts, the long-term trajectory remains upward.
Bracknell Forest
-
Offers a more affordable entry point than Wokingham but with a solid 10-year growth profile.
-
Recent data (2024–2025) shows continued modest price inflation, suggesting a fairly resilient market. Office for National Statistics+1
Reading
-
Has benefited from early and strong growth in the last decade, but is currently in a phase of slight price correction or pause, even as rents remain high. Office for National Statistics+2Office for National Statistics+2
-
For buyers, this could mean better value opportunities compared to the peak years, especially if mortgage rates continue to ease through 2026. The Guardian+2Nationwide+2